List of figures
Figure 1: Additive Manufacturing
Figure 2: Composite Metal Foam
Figure 3: Ceramic Matrix Composites
Figure 6: Isogrid Composites
Figure 7: Types of Composites
Figure 8: Different Types of Matrix
Figure 9: Types of Composites based on structural integrity
Figure 10: Fiber Reinforced Composites
Figure 11: Types of Particle Reinforced Composites
Figure 12: Segmentation for Structural Composites
Figure 13: Competitive benchmarking for composites versus commonly used metal
Figure 14: New Shepherd Rocket system
Figure 15: Composites allow airplane manufacturers to offer tailor-made cabin interiors
Figure 16: Components produced using Thermoplastic
Figure 17: E1000 Aircraft
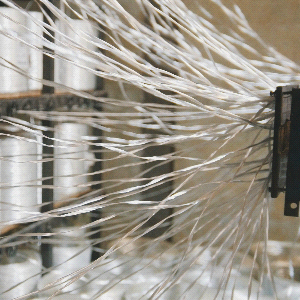
Figure 18: Early History of aramids
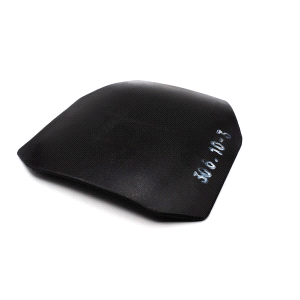
Figure 19: Soldier Protection System
Figure 20: Types of Composite Manufacturing Process
Figure 21: Types of Open Molding Processes
Figure 22: Hand Lay Up
Figure 23: Spray Up
Figure 24: Filament Winding
Figure 25: Closed Molding
Figure 26: Vacuum Bag Molding
Figure 27: Types of Cast Polymer Molding
Figure 28: Boeing 737 Max, Historic Deliveries and Forecast to 2029
Figure 29: Boeing 777, Historic Deliveries and Forecast to 2029
Figure 30: Boeing 787, Historic Deliveries and Forecast to 2029
Figure 31: Airbus A320, Historic Deliveries, and Forecast to 2029
Figure 32: Airbus A320 Neo, Historic Deliveries and Forecast to 2029
Figure 33: Airbus A350, Historic Deliveries, and Forecast to 2029
Figure 34: Drone Technology
Figure 35: F/A-18 E/F
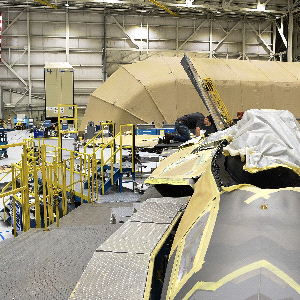
Figure 36: F-22
Figure 37: F 35
Figure 38: Gripen JAS 39
Figure 39: Rafale
Figure 40: Eurofighter Typhoon
Figure 41: Su-57
Figure 42: J-20
Figure 43: J-10
Figure 44: MQ-9B Skyguardian/SeaGuardian
Figure 45: Dassault Neuron
Figure 46: Sukhoi S-70
Figure 47: M20 Avenger
Figure 48: Ababil 3
Figure 49: Qods Mohajer
Figure 50: AM General HMMWV
Figure 51: Challenger 2 MBT
Figure 52: Aerospace and Defense Composites Market, By Region, 2021-2029
Figure 53: Aerospace and Defense Composites Market, By End Users, 2021-2029
Figure 54: Aerospace and Defense Composites Market, By Product, 2021-2029
Figure 55: Aerospace and Defense Composites Market, By Application, 2021-2029
Figure 56: Aerospace and Defense Composites Market, By Resin Type, 2021-2029
Figure 57: Aerospace and Defense Composites Market, By End-Users, 2021-2029
Figure 58: Drivers
Figure 59: Restraints
Figure 60: Challenges
Figure 61: Aerospace and Defense Composites Market Forecast to 2029 by Region [US$ bn]
Figure 62: Aerospace and Defense Composites Market Forecast to 2029 by Region [Percent]
Figure 63: North America Market Forecast to 2029 by End-User [US$ bn]
Figure 64: North America Market Forecast to 2029 by End-User [%]
Figure 65: Europe Market Forecast to 2029 by End-User [US$ bn]
Figure 66: Europe Market Forecast to 2029 by End-User [%]
Figure 67: APAC Market Forecast to 2029 by End-User [US$ bn]
Figure 68: APAC Market Forecast to 2029 by End-User [%]
Figure 69: Middle East Market Forecast to 2029 by End-User [US$ bn]
Figure 70: Middle East Market Forecast to 2029 by End-User [%]
Figure 71: RoW Market Forecast to 2029 by End-User [US$ bn]
Figure 72: RoW Market Forecast to 2029 by End-User [%]
Figure 73: North America Market Forecast to 2029 by Product [US$ bn]
Figure 74: North America Market Forecast to 2029 by Product [%]
Figure 75: European Market Forecast to 2029 by Product [US$ bn]
Figure 76: European Market Forecast to 2029 by Product [%]
Figure 77: APAC Market Forecast to 2029 by Product [US$ bn]
Figure 78: APAC Market Forecast to 2029 by Product [%]
Figure 79: Middle East Market Forecast to 2029 by Product [US$ bn]
Figure 80: Middle East Market Forecast to 2029 by Product [%]
Figure 81: RoW Market Forecast to 2029 by Product [US$ bn]
Figure 82: RoW Market Forecast to 2029 by Product [%]
Figure 83: Aerospace and Defense Composites Market Forecast to 2029 by Application [US$ bn]
Figure 84: Aerospace and Defense Composites Market Forecast to 2029 by Application [%]
Figure 85: Aerospace and Defense OEMs Market Forecast to 2029 by Resin Type [US$ bn]
Figure 86: Aerospace and Defense OEMs Market Forecast to 2029 by Resin Type [%]
Figure 87: Aerospace and Defense Aftermarket Market Forecast to 2029 by Resin Type [US$ bn]
Figure 88: Aerospace and Defense Aftermarket Market Forecast to 2029 by Resin Type [%]
Figure 89: Aerospace and Defense Others Market Forecast to 2029 by Resin Type [US$ bn]
Figure 90: Aerospace and Defense Others Market Forecast to 2029 by Resin Type [Percent]
Figure 91: Aerospace and Defense Composites Market Forecast to 2029 by Manufacturing [US$ bn]
Figure 92: Aerospace and Defense Composites Market Forecast to 2029 by Manufacturing [%]
Figure 93: Region wise Market Forecast (US$ bn)
Figure 94: Region wise Market Forecast (Percent)
Figure 95: Application wise Market Forecast (In US$ bn)
Figure 96: Application wise Market Forecast (Percent)
Figure 97: Manufacturing wise Market Forecast (US$ bn)
Figure 98: Manufacturing wise Market Forecast (Percent), Aerospace and Defense Composites s Market, 2021-2029
Figure 99: Aerospace and Defense Composites Market Scenario Analysis (US$ bn), 2021-2029
Figure 100: Aerospace and Defense Composites Market Scenario Analysis 1 (US$ bn), 2021-2029
Figure 101: Aerospace and Defense Composites Market Scenario 1 Region Wise Analysis (US$ bn), 2021-2029
Figure 102: Aerospace and Defense Composites Market Scenario Analysis 2 (US$ bn), 2021-2029
Figure 103: Aerospace and Defense Composites Market Scenario 2 Region Wise Analysis (US$ bn), 2021-2029
List of tables
Table 1: Physical Properties of Composites
Table 2: Types of Composite Matrix
Table 3: Physical Properties of Composites versus Metal
Table 4: Boeing 737 Max, Forecast Data
Table 5: Boeing 777, Forecast Data
Table 6: Boeing 787, Forecast Data
Table 7: Airbus A320, Forecast Data
Table 8: Airbus A320 Neo, Forecast Data
Table 9: Airbus A350, Forecast Data
Table 10: F18, Number of Aircraft Produced
Table 11: F22, Number of Aircraft Produced
Table 12: F35, Number of Aircraft Produced
Table 13: Gripen JAS 39, Number of Aircraft Produced
Table 14: Number of Rafale Produced since 1986
Table 15: Eurofighter Typhoon, Number of Aircraft Produced
Table 16: Su-57, Number of Aircraft Produced
Table 17: J 20, Number of Aircraft Produced
Table 18: J 10, Number of Aircraft Produced
Table 19: M1 Abrams, Number of Main Battle Tank
Table 20: Stryker, Number of Armored personnel carriers and infantry fighting vehicles
Table 21: Humvee, Number of Armored Personnel Carriers
Table 22: The FV4034 Challenger 2 , Number of Main Battle Tank
Table 23: Warrior IFV, Number of Infantry Fighting Vehicle
Table 24: Leclerc, Number of Main Battle Tank
Table 25: VBCI, Number of Infantry Fighting Vehicle
Table 26: VAB, Number of Armored Personnel Carrier
Table 27: C1 Ariete, Number of Main Battle Tank
Table 28: Dardo, Number of Infantry Fighting Vehicle
Table 29: Freccia, Number of Infantry Fighting Vehicle
Table 30: M113, Number of Armored Personnel Carrier
Table 31: Leopard 2, Number of Main Battle Tank
Table 32: CV90, Number of Infantry Fighting Vehicle
Table 33: Boxer, Number of Armored Personnel Carrier
Table 34: Arjun MBT, Number of Main Battle Tank
Table 35: Abhay IFV, Number of Infantry Fighting Vehicle
Table 36: TATA Kestrel, Number of Armored Personnel Carrier
Table 37: Leopard 2, Number of Main Battle Tank
Table 38: Puma IFV, Number of Infantry Fighting Vehicle
Table 39: Aerospace and Defense Composites Market Forecast to 2029 by Region [US$ bn]
Table 40: North America Market Forecast to 2029 by End-User [US$ bn]
Table 41: Europe Market Forecast to 2029 by End-User [US$ bn]
Table 42: APAC Market Forecast to 2029 by End-User [US$ bn]
Table 43: Middle East Market Forecast to 2029 by End-User [US$ bn]
Table 44: RoW Market Forecast to 2029 by End-User [US$ bn]
Table 45: North America Market Forecast to 2029 by Product [US$ bn]
Table 46: Europe Market Forecast to 2029 by Product [US$ bn]
Table 47: APAC Market Forecast to 2029 by Product [US$ bn]
Table 48: Middle East Market Forecast to 2029 by Product [US$ bn]
Table 49: RoW Market Forecast to 2029 by Product [US$ bn]
Table 50: Aerospace and Defense Composites Market Forecast to 2029 by Application [US$ bn]
Table 51: Aerospace and Defense OEMs Market Forecast to 2029 by Resin Type [US$ bn]
Table 52: Aerospace and Defense Aftermarket Market Forecast to 2029 by Resin Type [US$ bn]
Table 53: Aerospace and Defense Others Market Forecast to 2029 by Resin Type [US$ bn]
Table 54: Aerospace and Defense Composites Market Forecast to 2029 by Manufacturing [US$ bn]
Table 55: Aerospace and Defense Composites s Market Scenario Analysis (US$ bn), 2021-2029
Table 56: Aerospace and Defense Composites Market Scenario 1 Analysis (US$ bn), 2021-2029
Table 57: Aerospace and Defense Composites Market Scenario Analysis 1 (US$ bn), 2021-2029
Table 58: Aerospace and Defense Composites Market Scenario 1 Region Wise Analysis (US$ bn), 2021-2029
Table 59: Aerospace and Defense Composites Market Scenario Analysis 2 (US$ bn), 2021-2029
Table 60: Aerospace and Defense Composites Market Scenario Analysis 2 (US$ bn), 2021-2029
Table 61: Aerospace and Defense Composites Market Scenario 2 Region Wise Analysis (In US$ bn), 2021-2029